Build your own data visualization based on the 2019 Survey of Makerspaces Challenge Coin Data Visualization Design
About this event
With Jenn Deafenbaugh
Workshop designed for ages 13+.
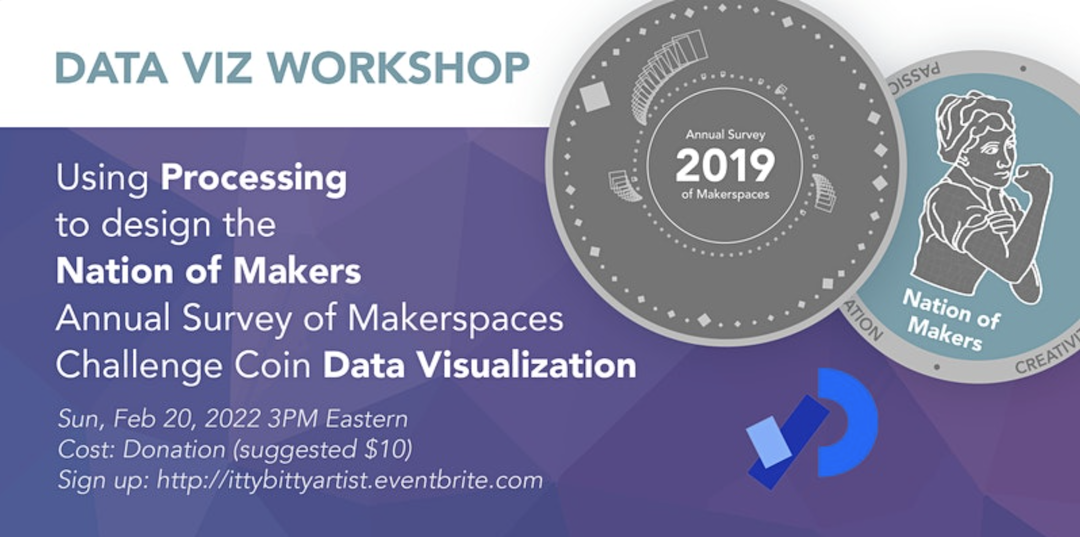
This little coin shows the makerspaces, leaders and members that completed the Survey of Makerspaces in 2019. Every year there's a survey, there's a coin - and we're hoping that this workshop inspires you to create a visual for one of our future coins!
We will through how the Nation of Makers 2019 Survey of Makerspaces Challenge Coin was designed and crack open Processing IDE to show you how to build this visualization. Add a data set of your own and you can create your own unique visuals!
This workshop assumes you know the following things ahead of time:
- What on earth IS Processing? https://youtu.be/5N31KNgOO0g
- What are variables? https://youtu.be/B-ycSR3ntik
- What's a Function? https://youtu.be/zBo2D3Myo6Q
- (Bonus points if you watch more of Dan's videos. He's spectacular.)
As long as you're confident about the above topics, age isn't an issue.
Please have Processing installed PRIOR to the workshop.
If you have trouble, message us on Eventbrite and we can troubleshoot it before class starts.
Are you a makerspace leader or member? Want a challenge coin for the current year's survey? Take the survey at https://makethedata.org/2022/01/10/2021-survey/. If all three surveys are received from your space, leaders and members who have filled in the survey will receive challenge coins.
Online
An event happening exclusivly via Zoom, Google Meet or similar online video communication system. A link will typically be shared via email once a person has registered or will be posted to the event page.